Choice of representation of currents
Interactions between ScanNav and WXTide
Documentation ScanNav
Tidal Currents module
The “Currents” module of ScanNav lets you display tidal currents overlaid on top of the chart. Currents data are originated from the SHOM French HO ("© SHOM 2005 - Reproduced with authorization of the “service hydrographique et océanographique de la marine – France » – Contract n° 30/2005 - www.shom.fr")
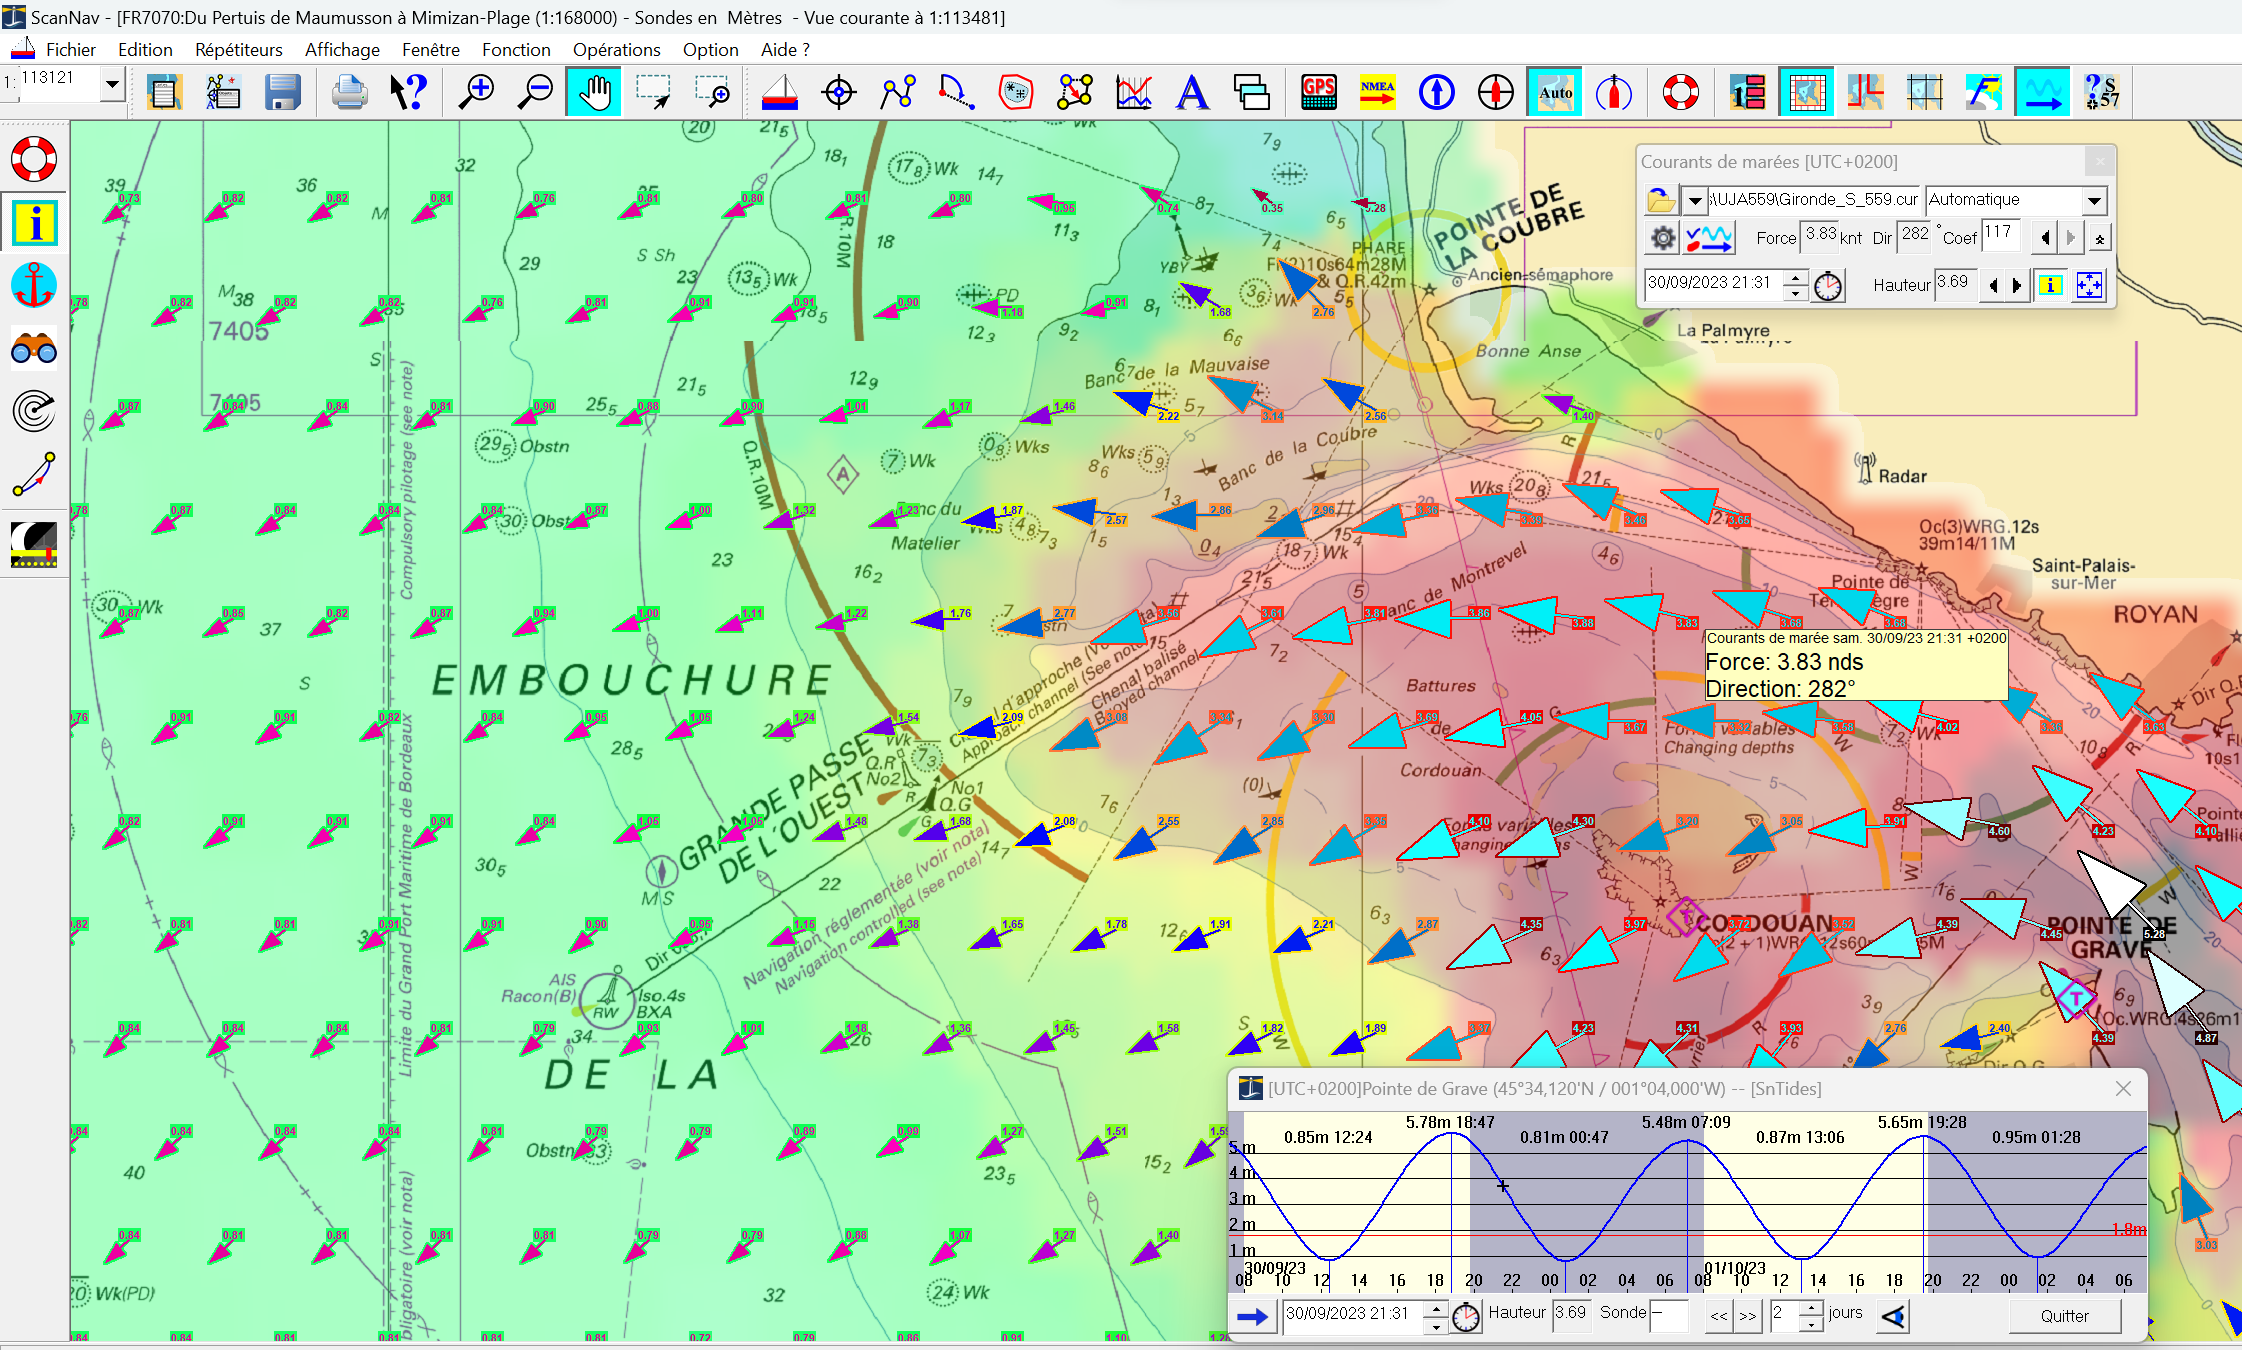
Currents calculation depends on the Tides heights and time, which are calculated by the SNTides module. Please refer to the pdf document for its full documentation.
It is also highly recommended to read the Release Notes related to the Currents module
The « Currents » module is available as an option. It also needs buying the appropriate Currents areas, which are sold individually (SHOM authorization n° 30/2005). The list of available regions can be consulted on line at http://www.scannav.com/GB/courants.html (URL submit to change, please refer to ScanNav’s home page in case of no reply)
It is possible to test the « Currents » module functionalities using a sample currents file provided with the distribution.
The procedure to obtain a license for the « Tidal Currents » module and/or any currents region is the same as for the standard license (Please refer to Obtaining a license). An order sheet is also available on ScanNav’s web pages.
To open the « currents » module, click on the
![]() button in the
main toolbar, or select the « Currents » entry in the « Options »
menu.
button in the
main toolbar, or select the « Currents » entry in the « Options »
menu.
The following control window will display, and if not the first time, the last selected currents region will be opened and shown on screen.
This window lets you control in a fast and easy manner the
currents information you want to display. You can hide the lower part of the
window to gain space on screen by clicking on the ![]() button. You just
have to click on the
button. You just
have to click on the ![]() button to display
this area again.
button to display
this area again.
![]() Open
a file selector to let you choose a new “currents” file among the region you
have on disk.
Open
a file selector to let you choose a new “currents” file among the region you
have on disk.
Since version 9.0, currents areas can be opened directly by right-clicking on the map and using the "Tidal currents" entry of the contextual menu which will show the list of files available for this area, sorted from the most to less detailed scale.
Note: if the sub-menu "Tidal currents" does not appear, verify that you are on a geographical area covered by the zones of UJA SHOM
For using current Gribs files, see Release Notes
![]() : Lets
you pick in a list of previously displayed files to switch quickly between
different files (click on the left arrow). The text shows the actually displayed
file.
: Lets
you pick in a list of previously displayed files to switch quickly between
different files (click on the left arrow). The text shows the actually displayed
file.
Notice: if you do not have the « Tidal Currents »
module you will not be able to open new files using the ![]() button,
and will only have the sample file in the previous list.
button,
and will only have the sample file in the previous list.
The ![]() button lets you
center the chart display on the actually displayed currents file.
button lets you
center the chart display on the actually displayed currents file.
The top-right list gives you different ways of choosing for which date you want to display the currents.
·
Either manually by choosing a fixed hour before
or after a high or low tide (depending on region) from Height Tide – 6hrs
(PM-6) to HeighTide+6hrs (PM+6), or Low Tide-6 (BM-6) to Low Tide + 6hrs (BM+6),
and entering a tides coefficient. You can go from hour to hour using the ![]() buttons under
this field.
buttons under
this field.
·
Either automatically by choosing the Xtide
entry of this list. In this case, you can choose any specific date, or the
present date, using the ![]() fields.
fields.
o
![]() Lets you choose
date (in MM/DD/YY format) and hour, by entering them in text, or using the
arrows to go forward or backwards. You can also go from 10 to 10mn by pressing
the « Ctrl » key while clicking on the arrows dedicated to time
field.
Lets you choose
date (in MM/DD/YY format) and hour, by entering them in text, or using the
arrows to go forward or backwards. You can also go from 10 to 10mn by pressing
the « Ctrl » key while clicking on the arrows dedicated to time
field.
o
![]() Gives you the
height of tide for the reference port associated to the current shown “currents”
file.
Gives you the
height of tide for the reference port associated to the current shown “currents”
file.
o
![]() Lets you step
from low tide to high tide and so on.
Lets you step
from low tide to high tide and so on.
o
![]() Sets the currents
display to present time. Then while in the pressed state, display will be
refreshed according to a delay defined in the parameters (see below). By pressing
it once more it releases the button and stops the automatic refresh.
Sets the currents
display to present time. Then while in the pressed state, display will be
refreshed according to a delay defined in the parameters (see below). By pressing
it once more it releases the button and stops the automatic refresh.
· A third possibility is to click on the WXTide’s curve, which will set the display of currents in ScanNav to the corresponding date.
![]() By clicking on
this button, a menu opens to let you choose quickly the type of display you
want:
By clicking on
this button, a menu opens to let you choose quickly the type of display you
want:
The type of display currently active is represented on the left of each button with the following symbols:
![]() « Values »:
The Currents strength and direction is represented with arrows more or less
big according to the current’s strength. The point of measure is the starting
point of the arrow. Other options related to the display type of arrows are
available in the advanced options.
« Values »:
The Currents strength and direction is represented with arrows more or less
big according to the current’s strength. The point of measure is the starting
point of the arrow. Other options related to the display type of arrows are
available in the advanced options.
![]() « Curves »:
Information is shown as iso-value curves according to an interval defined
in the advanced options.
« Curves »:
Information is shown as iso-value curves according to an interval defined
in the advanced options.
![]() « Filled
area »: Information is shown as color filled area using a transparency
level defined in the advanced options.
« Filled
area »: Information is shown as color filled area using a transparency
level defined in the advanced options.
« Scale »: Shows a scale of colors in an independent window. Only minimum and maximum values are displayed in text so as not to overload the display. To view the value corresponding to a specific color, just move the cursor to the scale at the desired position, and a popup window will display the corresponding value. This scale window can be moved or resized just like other repeaters.
Note: Currents can be represented in several different ways.
For example curves + filled area will give the symbol ![]() . If they are
represented with both “filled area” and “arrows”, the color
of arrows will be inverted so as to keep them visible on top of the filled
area
. If they are
represented with both “filled area” and “arrows”, the color
of arrows will be inverted so as to keep them visible on top of the filled
area
When moving the cursor over the map, ScanNav calculates interpolated direction and strength of currents under the cursor, and displays them in the appropriate text fields of the control window.
The ![]() button opens
a dialog box letting you change advanced general or display parameters.
button opens
a dialog box letting you change advanced general or display parameters.
This tab lets you configure the following parameters.
·
« Center chart on Currents area »:
When this box is checked, opening a new file centers and scales the map to
display the entire area covered by the new file (see also ![]() button described
above)
button described
above)
·
« Automatic update every …»: Lets you
specify the refresh delay to update currents display (see description
of ![]() button above)
button above)
· « Number of files in most recent list »: let you specify a limit to the number of files showing in the history list for a quick selection.
· « Save the configuration » opens a dialog box letting you choose a place to save the present settings so as to restore them later using « Restore a configuration ».
Enter a name for the backup in the input field and click on OK.
If you select an existing entry it will be overridden after a confirmation. The predefined « DefaultSetting » entry is reserved and cannot be overridden.
To delete en existing entry, select it in the list and click on the “Delete” button. Nothing will be effective until you click on the “Ok” button. If you click on “Cancel”, the actual settings won’t be saved, but if you had previously “deleted” one or more entries, you will be prompt if you want to really delete them.
· « Vectors » « Curves » and « Filled area » have the same meaning as through the menu displayed in the control window (see above).
· Arrow parameters:
o « Scale » and « Line width »: let you parameterize the size and line width of the arrows.
o « Filled arrows »: lets you choose between filled or outlined arrows.
o « Strength labels »: if checked currents’ strength will also be indicated in a text label under each arrow.
o « Highlight »: Each arrow (and label) will be highlighted with an inverse color outline so as to be visible whatever the background map color is.
· Curves parameters:
o If « display curve labels » is checked, each curve will have a text label showing its value
o « Interval » lets you define the spacing of the curves in the given unit.
o « Line width » lets you parameterize the thickness of the curves
o « Quality »: this lets you parameterize the smoothness of the curves, this is quite consuming in processor time. It is therefore recommended to leave this value at its lower value to the left. You might have to raise it a little if you notice some anomalies such as curves crossing each other or not closing properly.
· Filled area parameters:
o « Transparency » lets you choose the level of transparency so as to view the map more or less across the filled areas. The more the cursor is on the right the more the filling will be transparent and the map visible.
o « High quality »: Transparency uses some hardware and software resources that are quite recent in terms of technology, and that might not be present when running on old PC configurations. On recent hardware, this option should be checked. But on old hardware, transparency might be very consuming in terms of processor and result in a much too slow behavior. By un-checking this option, ScanNav will switch to an emulation mode of transparency which will let you gain a little on performances, at the cost of a lower rendering quality
o « Color gradients »: This option only has effects on old hardware, where color gradients are only available by emulating them by software. The more this cursor is on the right the smother the gradients will be, but also the slower the performances. It has no effect on recent configurations.
o « Interpolation »: This option is quite consuming in processor time and only useful in certain extreme cases to give a regular aspect to color gradients between different area. It is recommended to leave a low value (on the left). See illustrations in the documentation of the Grib module for more detailed explanations.
· The « Colors » list lets you customize colors to your preferences. To change one of the values, select the corresponding entry in the list, and click on the colored button on the right. This will open a color chooser letting you give any value you want. Defined colors are “step” colors, ScanNav computes intermediate colors for values between these steps by mixing the colors so as to give a regular color gradient.
· « Unique colors » (for arrows and curves) let you define a single color that does not change according to the currents strength. This can be useful for example when mixing currents information with weather information from the grib module so as to distinguish more the different types of information.
It is not possible in this version to change the interval of colors using the graphic interface. This might be possible in a future release. It is nevertheless possible for an expert to modify this parameter using the windows registry.
Warning: The following is given as information, and manipulations should be done by a windows expert, aware that a bad manipulation of the windows registry can cause dysfunctions on your windows system.
All information is saved in the windows registry. In the key « HKEY_CURRENT_USER\Software\Marc Lombard\ScanNav\ Tides\Currents.
You will find the following entries:
· « colorinterval »: lets you define the interval of values between each colors
· « minval »: gives the minimum value (every value lower or equal to this value will be assigned the first color)
· « ncolors »: gives the total number of colors (every value greater or equal to minval+ncolors*colorinterval will be assigned the last color)
To raise (or lower) the number of colors, you just have to change the « ncolors » value. Additional resulting entries will be assigned to black by default. You will just have to change these colors in the interface afterwards.
You can by the same mean raise or lower the minval and colorinterval values.
This registry key also has a sub-key named « Colors » that contains the list of defined colors, as « col0 », « col1 », ... « colN ». These are defined as RGB values: 8 low order bits = Red, next 8 bits=Green, next 8 bits=Blue, 8 high order bits set to 0. It is possible to change them here, but more convenient and safer to do it using the interface described above.
It is therefore possible to choose the source of the Tides in the general parameters of the currents module, between "SNTides" (by default), "Shomar" (to compare until 12/31/2023), or "WXTides". This possibility will probably be removed in the future, and we strongly recommend leaving the source at SNTides for better accuracy.
WXTide is an open source third party software
which has been adapted to communicate with ScanNav, and embedded in the
installation process. No other modifications were made apart from the
communication layer with ScanNav. The source code is available for
experts use.
The goal of this chapter is not to remake WXTide’s documentation but just to complete with topics specific to ScanNav’s interface.
WXTide lets you see tidal height curves in different display modes (through the « file » menu). The two recommended modes to use with ScanNav are « Graph » or « Overview »according to your preferences.
Graph Mode: fits best for one or two days display.
Overview Mode: Fits best if you want to display a larger period
Other views offer less interaction with ScanNav but are not incompatible.
The « always on top » entry of the « File » menu is also new compared to the standard version. It enables you to keep WXTide’s window always above other windows so as to show tides heights even when interacting with ScanNav (or any other application). If this option is not checked WXTide will disappear as soon as you click on ScanNav.
As seen above, you can choose a given date either in ScanNav or by clicking on WXTide’s curve, the 2 applications will synchronize, ScanNav showing the tidal currents and WXTide heights of the reference station.
When opening a new file in ScanNav, or choosing the WXTide entry in hours choice, WXTide will automatically switch to display the reference station associated to the currents file. Also, WXTide will be launched automatically if not already present.
It is then possible for you to change reference station in WXTide to show another location’s heights, this without affecting ScanNav that will continue to refer to the reference attached to the currents file.
It is also possible in ScanNav to query WXTide to point to the nearest known station from a specific point anywhere in the world. For this, just click with the mouse’s right button on the map at the desired location and select the “WXTide” entry of the contextual menu. This functionality is completely independent of the Tidal Currents and is available even without the “Tidal currents” module.
Precision of tides heights and times given by WXTide may vary according to stations locations. It is therefore mandatory to double-check with official paper documents.
Warning: No official Hydrographic Office has check information contained in this document nor can be granted responsibility regarding the fidelity of the reproductions or any further modification. Possession of this document doesn’t dismiss any obligation to use appropriate nautical documents according to national or international regulations.
Neither ScanNav nor WXtide authors may be granted responsibility in any manner what so ever regarding misinterpretation or eventually erroneous information.