Switching from one chart to another in a library
 Charts Auto loading parameters
Configuration of other instruments
Declination of the place of navigation
Automatic track simplification
Automatic Zoom to the most detailed chart
 Detailed charts bounding boxes
 All displays on top/in background
Uploading/Downloading Routes, Tracks and Waypoints to/from a GPS
Common properties to several waypoints
Specific implementation of notes related to routes (racing usage)
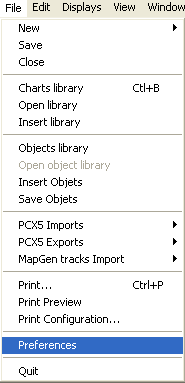
ScanNav Documentation
Navigation Mode
One of the goals of ScanNav is of course navigation aid. It gives you an NMEA input for your GPS and other on-board instruments, a mechanism for loading/unloading charts automatically optimizing memory usage, with possibilities to create danger areas and routes with waypoints, all of these being controlled by navigation control mechanism with alerts etc... The track with positions and other information received from connected instruments is logged on disk and can be further exploited as a graphical journal.
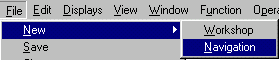
ScanNav opens by default in the mode it was on last usage, and in Navigation mode if it is the first usage.
To open a window in navigation mode when you were previously in Workshop mode, use the “New” entry of the “File” menu.
 Charts
Libraries:
Charts
Libraries:
Notice: From version 21.1, Navionics charts are handled differently from other charts. Please refer to the corresponding Navionics documentation..
The rest of this chapter applies to all other types of charts (as well as Navionics charts in the old mode for the XP version)
The Chart library is the key point in Navigation mode. It works the following way: You give ScanNav the list of charts that you might want to consult for your navigation area, and ScanNav will show the most appropriate chart(s) on the screen depending on the current zoom level.
To create a chart library, you just have to insert in it all wanted charts, and to save this list in a file. You then just have to load the library corresponding to your navigation area. Furthermore, the current chart library is saved automatically hen you exit ScanNav in navigation mode, and it is restored next time you restart ScanNav, the screen being centered at the last known position.
The chart library can be manipulated
through the ![]() tool, or
« Charts Library » entry of the “File” menu. A new window
containing the list of charts of the Current map library appears.
tool, or
« Charts Library » entry of the “File” menu. A new window
containing the list of charts of the Current map library appears.
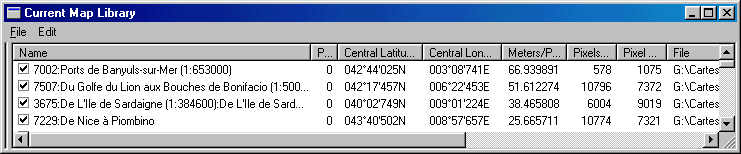
The list consists of a line for each chart giving appropriate information on each chart (latitude and longitude extents, scale…), each line being preceded by a check box. If it is unchecked, this temporarily inhibits the chart: it won’t be taken in account for the automatic loading mechanism to cover the screen. This can be useful in certain limit cases, where you’re in between 2 resolutions, and you don’t want ScanNav to load a particular chart. You can also change the chart priorities to show such or such chart in preference (highest priorities will be loaded first). Those priorities may be changed through the « properties » entry of the « Edition » menu (also appears through right clicking on the chart name). You can also use the « Load » entry to show the chart on the screen (left bottom of the chart will be displayed, and chart will be set as the reference.)
The menu enables you to open a new library, to insert a list of Charts or Charts libraries in the current library, to suppress charts from this library, and to save it to disk, as well as to show up chart Thumbnails. You also have the possibility to configure the displayed columns in the same manner as for the "Objects" window. (See columns configuration later in this document). You can also export the charts list (either just the selected items or the entire list) in a text file to print a catalog for example.
· This menu is also accessible through clicking the mouse’s right button in the right hand side of the window.
· You may also directly load charts library in the main window through the « File-Insert Charts Library » menu.
Having a chart in the library doesn’t mean it is loaded in memory. It is just referenced in case it is needed, and if so, only the visible part is actually loaded. The automatic load/unload mechanism will take care of unloading unnecessary files when they are not needed anymore.
The advised way to handle chart libraries is to have one library per CD, (or disk directory)
The best would be to save this library on the root of the CD. To do such a CD, group all the charts you want on your CD in a common directory (and eventually sub-directories), create the corresponding charts library in ScanNav by inserting all the wanted charts in it, and save this library in the directory to burn. Then burn the directory and its contents on the CD, without changing the directory structure. The library on this CD will then be able to be used “as is” on different PCs, even if they have different letters assigned to the CD drive (for example D: or E:), or if the CD contents is copied on the hard disk anywhere.
If your charts are already on CD (for example commercial BSB charts), you do not need to burn a new CD. Just create the chart library and save it to disk, it will work this way. Nevertheless, if you change the location of your charts (for example by copying them to the hard disk, or if the letter assigned to your CD drive changes), you will have to rebuild your library (this is a very quick operation).
If you change navigation area, then all you need to do is change your CD, and open the corresponding chart library. This will become the current chart library.
If you launch ScanNav when the CD containing the
charts used in last session is not in the CD drive (or the on disk
directory has been removed), you’ll get an error message. If you just
forgot to insert the CD, just do so and press the “Retry” button. But
if you don’t want to use these charts anymore, click on “Cancel” and go
directly to the “Charts library” window, using tool ![]() to load the new library or
create a new one.
to load the new library or
create a new one.
WARNING: A chart library must only contain maps with the same projection parameter; otherwise adjustments between the maps will be approximate, so erroneous. If you want to use charts of different projection systems in the same library, you will have to re-project them all to the same projection using the re-project tool of Workshop mode (“Operations” menu)
Switching from one chart to another in a library
Once you have built up your chart library, ScanNav manages to load and unload charts so as to cover the entire screen regarding your current position and zoom level. Nevertheless you some times want to go directly to a specific chart. This can be done in several ways.
· You can enter the library window and double-click on one entry to load it. In this case, the bottom left corner of the chart is shown on the screen.
· A more convenient way is by using the contextual menu appearing when you click on the screen with the right button. The last entry of this menu opens a submenu listing the charts containing the clicked point. By selecting one of these entries, you open the corresponding chart with the clicked point centered on the screen.
· Another good way to go directly to a given spot of a chart is by using the chart thumbnails described further in this document.
·
![]() This button is pressed by
default, which activates the automatic loading/unloading of charts by
ScanNav, according to the available charts, and current position and
scale. By releasing this
This button is pressed by
default, which activates the automatic loading/unloading of charts by
ScanNav, according to the available charts, and current position and
scale. By releasing this ![]() button (click on it to raise
it), this inhibits automatic loading of charts. This can be useful if
you want to work on a given chart, without it being replaced by another
one when scrolling or zooming around the screen. To reactivate
auto-loading just click back on it to set it active. The screen will
then reload automatically with the best-fit charts.
button (click on it to raise
it), this inhibits automatic loading of charts. This can be useful if
you want to work on a given chart, without it being replaced by another
one when scrolling or zooming around the screen. To reactivate
auto-loading just click back on it to set it active. The screen will
then reload automatically with the best-fit charts.
· See also the Scrolling and zooming chapter in the ScanNav.htm document
Using Chart Thumbnails:
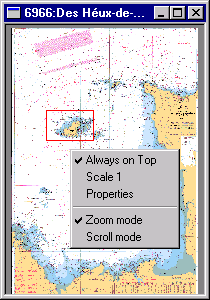
Thumbnails created while saving charts can be shown in separate windows and used to quickly move around the maps at specific locations. To show up a thumbnail window, you can use the Chart Libraries window’s menu, or the contextual menu of the main window, which appears when you click with the mouse’s right button on a chart. These thumbnail windows can be resized as you wish.
If a thumbnail doesn't exist when you ask for it (case of BSB charts for example), ScanNav asks you if you want to create it. In that case, it saves the built thumbnail on disk in a directory to avoid having to recalculate it later on. This directory must be configured in the preferences (see next chapter).
A red box represents the area showed in the main window. If this box id not visible, that means the area is either too small or too big to be significant.
When you click on a spot of an icon, the main window shows the correspondent chart at scale 1 with the clicked spot centered on the screen. If you drag the mouse while button still down, the action is different depending on the current mode (see below).
A contextual menu shows up if you click on the mouse's right button. It has the following entries:
· Always on top: When checked this force the window to stay on top of all other windows of the desktop.
· Scale 1: If you select this entry the map will be shown with the clicked point centered on the screen, and at scale 1.
· Properties: this opens the map's properties dialog.
Other entries define how the left button click acts on the thumbnail window:
· Zoom mode: (by default) In this mode, if you drag the mouse while left button is down, you define a box, and when releasing the mouse's button, the defined area will be scale to fit in the main window.
· Scroll Mode: In this mode, if you drag the mouse while left button is down, you move the main window displayed area.
èYou can toggle temporarily this behavior by pressing the <Ctrl> key while clicking in the window.
èWhen you move the mouse inside the thumbnail window, it has the same effect as moving it inside the main window at the corresponding area. This enables you for example to know the distance (approximate due to the thumbnail's resolution) of a point completely at the opposite of the chart, without having to move the main window to it.
Charts Auto loading parameters:
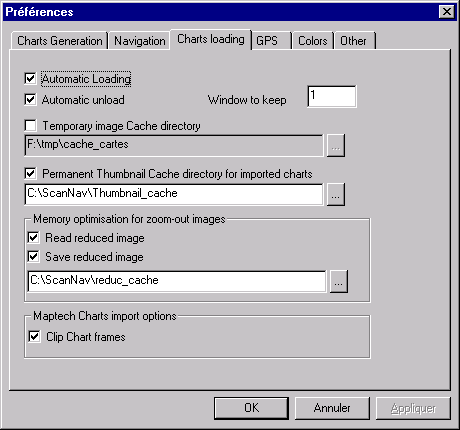
The "Charts loading" tab of the Preferences (accessible through the "Preferences" entry of the "File" menu) lets you enter parameters on the way ScanNav will load charts in memory, as well as diverse parameters to improve its performances.
·
"Automatic loading" » makes
ScanNav fill automatically the screen with the best-fit chart(s) from
the library regarding the current zoom. This should always be checked.
The ![]() tool
described above performs the real control of the automatic loading.
tool
described above performs the real control of the automatic loading.
· . « Automatic unload » tells ScanNav to automatically unload from memory image files not visible on screen, so as to optimize memory usage. This is done with a certain tolerance that you can indicate in the input field « window to keep ». This value defines the number of screens to keep out of the current screen. For example, a value of 1 indicates you want to keep in memory the equivalent of one window on the vertical axis and one window on the horizontal axis, which means images won’t be unloaded from memory until they are completely out of the screen more than half a screen to the left, right, top, or bottom. (So you finally keep 4 screens in memory). If the value is 0, any image completely out of the screen are immediately unloaded. This should also always be checked.
· "Temporary image cache directory" sets up a cache of unloaded images. This mechanism permits ScanNav to save slow loading files such as GIF, or files from a CD, in fast loading format to a temporary directory before unloading them, so as to reload them faster if needed again. This can be useful for older PCs avoiding to get slowed down with uncompressing times, or waiting for the CD-ROM. You must make sure you have enough temporary disk space before. By default this option is not active.
· "Permanent Thumbnail cache directory for imported charts" lets you define the directory where ScanNav saves the calculated thumbnails for charts that do not include one. (BSB charts for example). This improves a lot thumbnail window creation, as they are created only once. Generated files remain on disk after ScanNav exits, ready for next use. Thaw they are compressed, they can end up by taking significant space on disk if you have a lot of charts. So if you run out of disk space, you can just empty the cache directory, the only consequence will be that ScanNav will have to recalculate the thumbnails. So make sure not to put other files in this directory so as to be able to clean it easily.
· When you "play" a lot with zoom levels, especially with zoom-out, performance can be critical. "Read reduced image" optimizes memory usage in such case by telling ScanNav to re-read the image partially at small zoom levels. And to avoid having to reload and calculate the image too often "Save reduced image" lets you specify a cache directory where those reduced images will be saved temporarily (deleted when ScanNav exits).
· « Antialiasing » improves the on screen rendering of chart images, especially when zooming out. Warning: this option is nevertheless a little more consuming in terms of performances. So if you notice low performance on old PC configuration, you can deactivate this check box to raise the performances.
You can use the ![]() buttons to open a directory
selector to choose cache directories.
buttons to open a directory
selector to choose cache directories.
Charts include the classical frame containing
Latitude and longitude marks. "Clip chart frames" tells ScanNav
to hide those frames, so that when showing adjacent charts on the same
screen, these will fit together, without the frame of one chart hiding
a part of the other chart. This option is also available through the
“Option” menu, or using the ![]() button letting you toggle quickly between showing and hiding the
frames.
button letting you toggle quickly between showing and hiding the
frames.
Initial parameters:
Before using ScanNav in navigation mode, you will have to check a few parameters using the preferences:
GPS Interface Configuration:
The first thing to do is to configure the GPS interface. Go in the « GPS » tab, and enter the appropriate values for the COM port, speed, etc…. Values to set depend on your GPS settings, but most typical default values should fit in most cases as they are based on the NMEA standard. These default values are:
· Speed for NMEA mode: 4800
· Speed for Waypoints transfers mode: 9600 for Garmin and 4800 for MLR (See Upload and Download of routes and waypoints from/to the Gps)
· Data bits: 8
· Parity: None
· Flow Control: Xon/Xoff
· Stop bits: 1 (2 for MLR)
If your GPS is configured on COM port not present
in the list, you can configure a new port using the ![]() button. This opens a new
dialog box letting you add the port number assigned to the GPS.
button. This opens a new
dialog box letting you add the port number assigned to the GPS.
The two timeouts values indicate the timeout values after which the GPS alarm will ring. Those two timeout cases are:
· Communication timeout: If no communication at all is detected coming from the GPS. This can have several causes, most probable being a defect in the cable, or the GPS switched off, or configured to a wrong protocol. This timeout is by default of 2 seconds. If you detect problems from time to time, it might be that the GPS is configured to “talk” at a greater interval. You may then higher this limit.
· Satellite reception timeout: this is the maximum value between position information coming from the GPS. This timeout occurs if the GPS gets poor reception from the satellite. It is set to 10 seconds by default.
Also check in the NMEA configuration of the GPS, that at least one of the GPRMC, GPGGA, or GPGLL sentences are activated, as they are mandatory to get position information. The GPVTG sentence will also be needed if you want to show the bearing and speed of the GPS, and if GPRMC is not available. Otherwise, ScanNav will calculate it but with less accuracy.
The interpolation distance is given in meters. Points given by the GPS and distant than less than this value will be "averaged" to compensate the SA error of the GPS. This error being of about 100 meters max, a value of 50 meters seems reasonable. If you own a DGPS, you should lower this value. If you enter a value of 0, there will be no interpolation, and the raw values given by the GPS will be used to calculate course and speed, and at a normal boat speed, the course shown of the ScanNav's display will oscillate so it won't be of any usage.
But since May the 2nd 2000, the SA error has been suppressed. The precision of the GPS has by this mean increased a lot. So, the interpolation distance is now not as important, and can be lowered to just a few meters (around 5, to be confirmed by experience)
The "Datum" button lets you parameter the GPS's Datum. This is detailed in next chapter.
The model choice is just here for download/upload of routes and waypoints to/from different GPS brands (see Upload and Download of routes and waypoints from/to the Garmin Gps), as they all use a different protocol for this purpose. Nevertheless all GPS supporting NMEA 183 will work in navigation mode, as it is a standard.
In case of trouble shooting while configuring your GPS settings, you can check the box “Log NMEA sentences in directory” and specify a directory name where all the NMEA sentences will be logged. A new file in this directory is created each time you activate the GPS interface or simulator. Warning: these files can grow very fast! The main usage of this is only for debug: if for some reason or other your GPS interface doesn’t work, try activating the log for a few minutes (you have to activate the GPS interface after having checked the « log to directory » check box, stay a few minutes… and stop the GPS interface). The contents of the log files will help determine the origin of the problem in relation with the ScanNav support.
GPS and Grid Datum:
The DATUM used by the GPS is fundamental pour the precision of position calculations. (The difference can be up to several hundred meters!). This must be set to the same value on ScanNav and the GPS. It is strongly recommended to set both of them to WGS84, which is the actual standard, but you might eventually use another datum if most of your charts use this one. The Datum of the GPS is the same as the one used for the Grid. Its settings are accessible through the "Datum" button of the GPS configuration box.
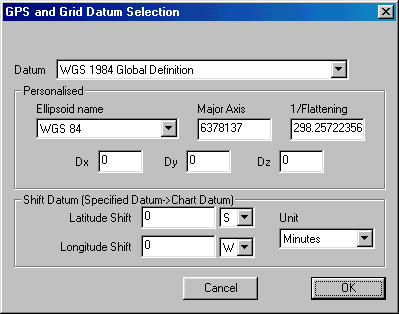
The Datum must correspond to the one configured on the GPS. If you have charts in a datum different from the GPS's settings, you will see that the ScanNav's grid will be shifted compared to the map's printed grid. This is totally normal, and is due to the difference between the 2 datum systems. Refer to Workshop - Datum for more precision on the datum, and how to enter the parameters.
· Note: The configuration of the GPS and Grid datum has no meaning in Workshop mode, where we use the Chart's datum to reference the map in its native system. In Workshop mode the ScanNav’s grid must then correspond to the map’s printed grid.
Configuration of other instruments:
If all you instruments including the GPS are connected to ScanNav through a unique central (one unique cable connected to the pc), you don’t need to configure anything else. But if your instruments are connected independently from each other, you will have to configure a connection for each serial cable connected to the pc. In order to do this, choose the “Instruments” tab of the preferences:
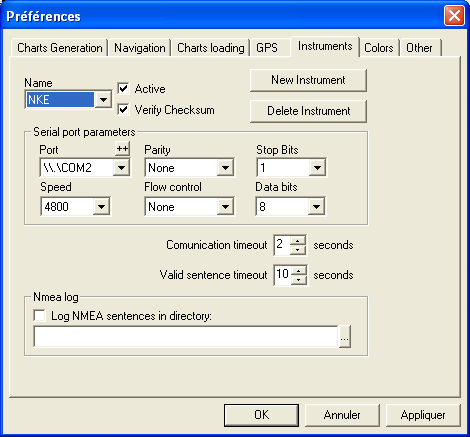
For each independent instrument, do the following:
· Click on the « New instrument » button (all other fields are grayed out on first run)
· Give a name to the instrument as asked by the popup dialog and validate. You can choose any name, it is not related to the type of instrument that is plugged
· Choose the COM port where the instrument is plugged, and verify settings such as speed etc… in the same manner as for the GPS (default settings should do just fine as they correspond to the NMEA standard)
· Verify that the « Active » check-box is checked (otherwise the instrument will not be listened to)
· Repeat these operations for all physical COM port connection where some instruments are connected.
·
è The instruments will be listened to at the same time
than the GPS activation ( ![]() )
if the corresponding “Active” option is checked.
)
if the corresponding “Active” option is checked.
Navigation Preferences:
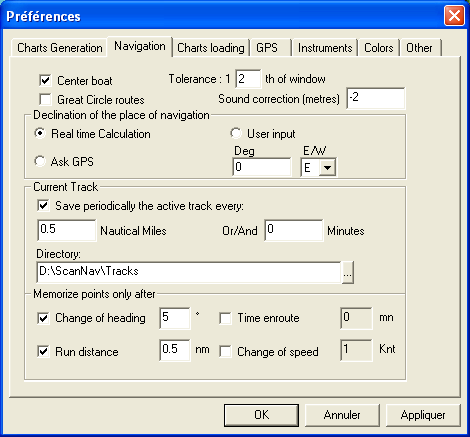
The Navigation tab of the preferences allows you to enter some parameters on ScanNav's behavior in navigation mode.
Moving boat on screen:
This lets you tell how your charts and boat are
going to move around the screen. The "Center Boat" option is coupled
with the ![]() button
included in the navigation mode toolbar. If it is not checked, the
chart will not follow automatically the boat (it can go out of the
screen). Use this mode if you want to explore charts without taking the
boat’s position in account. If it is checked, the boat will stay in the
middle of the screen with a certain tolerance, the map moving around
it. The tolerance is expressed in portions of the screen. The higher
this value, the more often the chart will move. For a value of 1, the
boat will move inside the screen until it reaches the limits of the
screen where it will be re-centered. For a value of 0, the boat will
stay fit in the middle of the screen, the chart moving around it (but
for this version, North is always Up, and the boat’s axis changes to
reflect the direction). For a value of 8, the boat will move until it
has reached a 8th of the screen, and it will then be
re-centered on the screen…
button
included in the navigation mode toolbar. If it is not checked, the
chart will not follow automatically the boat (it can go out of the
screen). Use this mode if you want to explore charts without taking the
boat’s position in account. If it is checked, the boat will stay in the
middle of the screen with a certain tolerance, the map moving around
it. The tolerance is expressed in portions of the screen. The higher
this value, the more often the chart will move. For a value of 1, the
boat will move inside the screen until it reaches the limits of the
screen where it will be re-centered. For a value of 0, the boat will
stay fit in the middle of the screen, the chart moving around it (but
for this version, North is always Up, and the boat’s axis changes to
reflect the direction). For a value of 8, the boat will move until it
has reached a 8th of the screen, and it will then be
re-centered on the screen…
Great Circle routes:
If this option is checked, route segments will be drawn using Great circle route. This being a little bit time consuming, it is recommended to reserve it to high sea navigation, as it has no visible effect on coastal navigations.
Sound correction:
You can enter here a correction of the displayed depth so that it shows the total height of water, or the depth under the keel, or any other reference:
· To show the total depth from the surface, enter a positive number corresponding to the depth of the sound from the water surface.
· To show the depth below the keel, enter a negative values corresponding to the height of the sound regarding the bottom of the keel.
Declination of the place of navigation:
This can be set to 3 values:
· Real Time calculation: The declination of the boat's position (or/and of the cursor) is calculated permanently from tables valid until year 2005. Those tables will evolve and be available later on for further dates.
· Ask GPS: GPS also can send the value of the declination at the current position. The inconvenient is that this value is only valid for the boat's position, and is thus not usable for consulting charts outside the navigation area, or without the GPS plugged in.
· User Input: This possibility was previously the only available one. It has stayed for un-conditionals of manual input J. But beware this value is fixed, and is not verified.
Current Track parameters:
You can enter here the interval at which the current track will be automatically saved on disk. You can enter a distance in Nautical miles between 2 points, or/and a time interval between two points. (For example: backup the track every mile, and at least every 10 minutes of time).
You also must indicate a valid directory where the active track will be saved. This enables you to recover an ancient track from a previous ScanNav session, automatically. You can also consult the old tracks that are saved there for further analysis. One file is created for each track; its name is calculated from the track start date. Its format is: GPSAAAAMMJJ_HHMMSS.trk. For example the file "GPS20000825_170225.trk" contains the track that began on August the 25, 2000 at 5.02PM and 25 seconds. The functionality is activated by default using the sub-directory "Tracks" of the ScanNav installation directory.
Clarification: This directory is used only for automatic backups, in order to be able to resume the active track, or to recover the tracks manually in case of crash of the PC. It is not used outside this scope, and files may be deleted without effect on ScanNav. The reference file is the "curobjets.zrw" file in the "ScanNav Settings" folder, where all objects (routes, waypoints, traces, areas, notes, ...) are stored. This is saved when existing ScanNav, or explicitly when the diskette button is pressed, or using menu "File" => "Save". See also "Release Notes" for automatic archiving of objects.
Automatic track simplification:
Options in frame “Memorize points only after” let you minimize the GPS logged information. ScanNav will only keep points reveling a change in the checked conditions. In the above example, a point will be kept whenever the heading changes for more than 5°, or on speed changes of over 1 knot, and at a minimum interval of half a mile. If none of these options are checked, all points received by the GPS are kept, which can result in slowing down the application due to excessive track length.
Color choices:
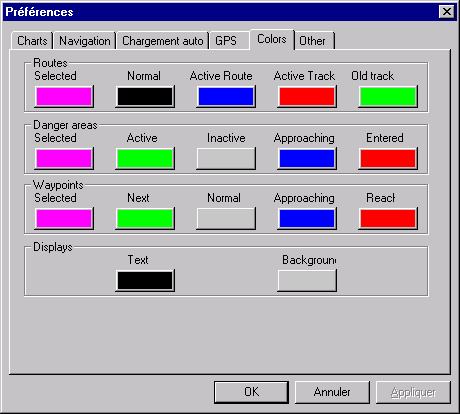
You can choose the colors of tracks routes, danger areas and waypoints depending on their state. You can also choose the color of the text and background of the displays. When you click on one of these buttons, you open the standard windows color dialog where you can choose the color you want. You can get help on this dialog by clicking the "?" icon on its title bar.
Navigation options:
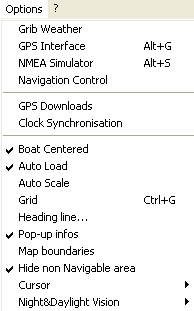 Navigation options are accessible
thru the « Options » menu, or directly using buttons
available in the toolbox:
Navigation options are accessible
thru the « Options » menu, or directly using buttons
available in the toolbox: ![]()
Note: a few tools are not present in the standard navigation toolbar. These extra tools are nevertheless available by creating an extra custom toolbar (see the chapter disposition of toolbars for more details). The concerned tools are the following:
![]()
NMEA Interface: 
To activate the NMEA input from your GPS and
other configured NMEA instruments, just press the ![]() button
of the navigation toolbar. It is equivalent to check the « GPS
Interface » entry of the « Options » menu.
button
of the navigation toolbar. It is equivalent to check the « GPS
Interface » entry of the « Options » menu.
When it is pressed down, ScanNav listens to the GPS and other configured instruments, to get its positioning and other information. An icon appears at the bottom-right of the screen to reflect the good or bad status of the GPS. This icon can take three states:
·
![]() : Every thing is OK. The GPS sends
regularly positioning information to ScanNav.
: Every thing is OK. The GPS sends
regularly positioning information to ScanNav.
·
![]() : The communication interface
between the PC and the GPS is functioning all right, but the GPS is not
sending any positioning information. This can be due to poor satellite
reception (if you inside a building for example), or to a bad GPS
configuration that is not sending one of the GPRMC, GPGGA or GPGLL
sentences needed by ScanNav.
: The communication interface
between the PC and the GPS is functioning all right, but the GPS is not
sending any positioning information. This can be due to poor satellite
reception (if you inside a building for example), or to a bad GPS
configuration that is not sending one of the GPRMC, GPGGA or GPGLL
sentences needed by ScanNav.
·
![]() : Means you have a serious
communication between the GPS and the PC. Check your cable and the
interface parameters such as speed that should be set the same on the
GPS and ScanNav.
: Means you have a serious
communication between the GPS and the PC. Check your cable and the
interface parameters such as speed that should be set the same on the
GPS and ScanNav.
When the GPS looses the satellite reception, or a communication problem occurs between the PC and the GPS, an alert box is also displayed. If you detect intermittent loss of signal, it can be that your GPS is configured to send information at a lower rate than the ones defined in the preferences. In this case you can modify these timeout values described above in the GPS preferences settings.
The same happens if one of the other connected instruments encounter a communication problem. The above-described icons nevertheless only reflect the GPS state
NMEA Simulator:
If you don’t have a GPS, or to familiarize with ScanNav, you can use the NMEA simulator (this simulator only simulates the GPS, not other instruments such as wind etc…) To activate, select the « NMEA simulator » of the « Option » menu. A new dialog appears letting you input your parameters and start the simulator.
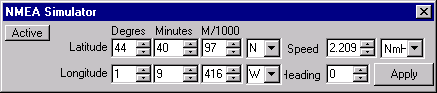
Enter your desired parameters (position, speed and heading), and press the « Active » button to start the simulator. Position is given in Degrees, Minutes, and 1/1000 of minutes, Speed in Knots or Kilometers per hour, and heading in degrees.
The simulator runs when the « Active » toggle button is down. In this state, you cannot modify the position as ScanNav permanently updates it. As for the speed and bearing, you can change them any time, but have to press the « Apply » button to confirm.
Notice: Each time you inactivate and reactivate « GPS Active », a new track is created automatically. This track is handled by the GPS interface that creates regular waypoints in which it saves vital information such as the date and position. You can save this track to disk to consult it later on as a journal, or re-plot it on your chart to review your trip. The laps of time and/or distance separating two waypoints can be set up in the « Navigation » tab of the « Preferences » dialog.
Navigation control: 
You can give ScanNav a destination waypoint and eventually a route to follow. This is to be used in conjunction with the heading correction repeater and/or the out of route or heading alarms (see further in this document). This can be done in the following ways:
· Through the routes properties (see chapter « Creation of routes »)
· By clicking on an existing waypoint with the right button and selecting the « Navigate to » entry of the menu
·
By clicking on the ![]() button of the navigation
toolbar
button of the navigation
toolbar
In the last two cases, the following dialog opens:
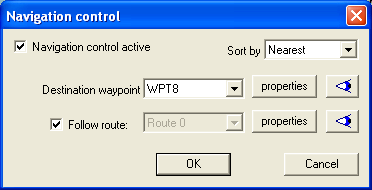
If this was opened using the ![]() tool, it is initialized with
the currently active navigation control parameters, and if it is opened
using the right-click on an existing waypoint, it is initialized
according to this waypoint’s properties.
tool, it is initialized with
the currently active navigation control parameters, and if it is opened
using the right-click on an existing waypoint, it is initialized
according to this waypoint’s properties.
· You start or stop navigation control by checking or un-checking “Navigation control active”.
· Using « Sort by » you can sort waypoints either by name or by nearest location to the selected waypoint.
· If “Follow route” is not checked, destination waypoints will not change automatically while progressing in a route, and no control will be made regarding the route corridor.
o This check-box is grayed out if the waypoint doesn’t belong to any route
o The field containing the route’s name will most of the times be grayed out. It only activates if the waypoint belongs to several routes letting you then choose the appropriate route.
- The
 buttons lets you position the
chart in a fast manner at a waypoint location or view the entire
selected route.
buttons lets you position the
chart in a fast manner at a waypoint location or view the entire
selected route. - You can also view/modify the properties of the waypoint or route using the « properties » buttons
Instant
mark, or MOB: 
This function lets you easily create a waypoint at the current position.
The name is automatically calculated using string “MOB” and the current time, and the comment field is filled in with the current position, date and boat heading and speed. The displayed icon is always the Buoy symbol.
The waypoint is created by clicking on the ![]() button, or by pressing the “Enter”
key of the keyboard. The waypoint creation dialog box then opens, and
you just have to press “Enter” again or click on the “Ok” button to
validate. But you also can change any pre-calculated fields if you want.
button, or by pressing the “Enter”
key of the keyboard. The waypoint creation dialog box then opens, and
you just have to press “Enter” again or click on the “Ok” button to
validate. But you also can change any pre-calculated fields if you want.
Please refer to the “Release Notes” for a full description of the MOB tracking system.
This function can also be very useful to mark fishing places or other information to record as a journal. (See chapter “User Interface” in the release notes for description of shortcuts to manage instant waypoints)
Center boat: 
This button lets you tell how your charts and boat are going to move around the screen. . If it is checked, the boat will stay in the middle of the screen with a certain tolerance defined in the preferences, the map moving around it. If it is not checked, the chart will not follow automatically the boat (it can go out of the screen). Use this mode if you want to explore charts without ScanNav bringing you back to the boat’s position permanently.
Auto Load:
This button is pressed by default, which
activates the automatic loading/unloading of charts by ScanNav,
according to the available charts, and current position and scale. By
releasing this ![]() button (click on it to raise it), this inhibits automatic loading
of charts. This can be useful if you want to work on a given chart,
without it being replaced by another one when scrolling or zooming
around the screen. To reactivate auto-loading, just press the button
again. The screen will then reload automatically with the best-fit
charts.
button (click on it to raise it), this inhibits automatic loading
of charts. This can be useful if you want to work on a given chart,
without it being replaced by another one when scrolling or zooming
around the screen. To reactivate auto-loading, just press the button
again. The screen will then reload automatically with the best-fit
charts.
Automatic Zoom to the most detailed chart:
This functionality enables you to automatically zoom on and set as the reference the most detailed map of the boat's position. This is only done when the boat enters or leaves the map's coverage area. This functionality is active if the "Auto Scale" entry of the "Options" menu is checked.
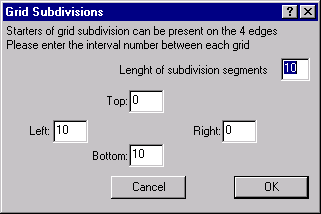
Grid parameters: 
You can define if you want to show a Mercator Grid, or UTM Grid (or both), and define its line spacing. You can also have access to this parameter through the "Grid" entry of the "Options" menu, or the "<Ctrl>g" keyboard shortcut. The "Subdivisions" pushbutton lets you define graduations dividing this grid on the screen (or printed sheet) boarders, for more precision. The following dialog box opens when activating this button. It lets you enter the length of these graduations as well as their interval on each side (0 means no interval for this side):
Heading Line and Range Ring: 
Please also refer to the Release notes
By clicking on the ![]() button of the navigation
toolbar, or through the "Heading Line…" entry of the "Options" menu,
you can define a set of indicators around the boat. These are:
button of the navigation
toolbar, or through the "Heading Line…" entry of the "Options" menu,
you can define a set of indicators around the boat. These are:
· Heading Line: When this option is checked a heading line is drawn ahead of the boat on its heading axis.
· Range Ring: When this option is checked, a circle is drawn around the boat's position. Its ray can be entered in Nautical Miles (NM), Kilometers (KM), or Meters (M).
· Time Graduations: When this option is checked, the heading line is graduated according to the boat's speed. If for example you enter 60 in the associated field, the first graduation will be at the spot the boat should be in one hour, the 2nd in two hours, etc… if the boat continues at the current speed. The first segment of the bearing line will also be thicker.
· Distance Graduations: this option is similar to the previous, except that the graduation will be according to a fixed distance instead of the current speed.
The two graduation options are exclusive. You can only activate one at a time.
Detailed
charts bounding boxes
It is possible to show a red bounding box of the available detailed maps of the current chart library. To do so, use the "option" menu of the main window.
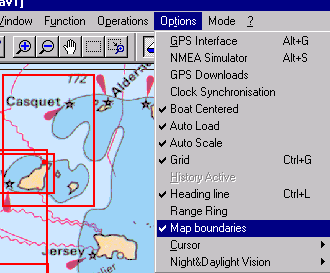
Hide Non navigable areas: 
Charts include a classical frame containing Latitude and longitude marks. With the “Seamless” mode of ScanNav where charts are adjusted together to make a continuity, you don’t want to see those frames as they will hide a part of the adjacent chart. If you inactivate this option, frames become visible again, which might be useful for different reasons (to control the validity of the chart or print it out for example).
All displays on top/in
background
This button lets you put all the separate instruments repeaters in foreground or background in a single operation. (See Displays further in this document)
Popup-info: 
When this button is pressed down, additional objects information is displayed in a popup window when keeping the mouse cursor on their position. The displayed information is dependant of the type of object:
· Waypoints, Danger areas, and Notes: name and comment fields
· Routes: name and comment, total distance, leg’s distance and heading.
· Tracks: name and comment, date, instant ground heading and speed.
Night vision:
Night vision has been completely revised for version 23.1. See new documentation in the release notes.Uploading/Downloading Routes, Tracks and Waypoints to/from a GPS:
If you own a Garmin GPS or a Valsat MLR, you can use ScanNav to transfer your routes or waypoints defined by simple clicks, to the GPS, or to retrieve Tracks (Garmin only), etc… from the GPS to show them on the map or save them to disk. I also plan to implement this functionality for Magellan and Lowrance shortly.
The NMEA interface will be stopped during uploading / downloading.
Upload/Download Dialog box:
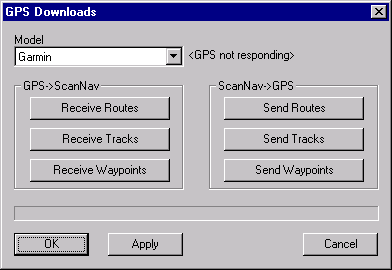
It opens through the « GPS Downloads » entry of the « Option » menu.
The GPS brand is recalled at the top of the dialog. You may change it here, but it is recommended to change it in the "Preferences" dialog box, so as to check the port settings.
For Garmin, the current GPS model and software version is also indicated. If this shows « <GPS not responding> », this means your connection or interface parameters are bad. If a dialog box warns you that it cannot open the line, that probably means another application is using the port, or that you chose the wrong one.
The three buttons at the left-hand side are to Download information from the GPS to ScanNav, and the three buttons on the right to Upload the GPS with ScanNav’s routes etc…. A progress bar lets you know about the state of the transfer.
· When you click on one of the « Send » buttons, a window shows up in which you must select what you want to send to the GPS. For routes, an extra field asks you for the first route number you want to overwrite in the GPS (subsequent routes will increment this number). This dialog appears before the transfer begins.
· When you click on one of the « Receive » buttons, ScanNav first transfers all the information from the GPS, then shows you the same dialog, where you select the elements you want to get in ScanNav. These elements will only be incorporated into ScanNav after you click on « Apply » or « OK » (« Apply » doesn’t close the dialog, so you can make several transfers in a row).
Pay Attention to the Datum settings used for transfer. ScanNav considers all information received from the GPS as being expressed in the Datum that is currently set in the preferences dialog, and all information sent to the GPS are previously converted to that Datum. I noticed that on Garmin 12 model (and probably other Garmin models); every thing transferred is considered by the GPS as being expressed in WGS84, whatever the GPS settings are set to. But I haven't found any specifications on that, and don't know if it applies to all Garmin GPS, and furthermore for other brands. So, by precaution, make sure your settings are set to WGS84 on both ScanNav and the GPS, before you launch any transfer. (See the "GPS and Grid Datum" in the Navigation mode document.)
Garmin GPS:
This functionality uses the Garmin proprietary protocol, which is different from the NMEA protocol. To use it, you have to modify the settings of your GPS’s interface to Garmin/Garmin. Moreover, GPS use different serial line configurations when they are in Garmin mode or NMEA mode. Usually they use a default baud rate of 9600 in Garmin mode, and 4800 in NMEA mode. But on recent GPS, this can be configured. So make sure to give the right speed values for both modes in the "GPS" tab of the "Preferences" dialog box (see GPS Configuration).
Valsat MLR GPS:
Three MLR models are present in the list: the MLR FX312, the MLR SP12X and the MLR Valsat 2008. The FX312 has the icon feature that SP12X doesn’t. The MLR SP24 or SP24XC are also managed with the FX312 model. Another model "MLR?" is also present in the list. It corresponds to another protocol documentation that is probably out of date, but I left it just in case… So if you own a Valsat MLR that is not in the list, you may test one of these four models, it has a good chance of working. If the GPS has icons features it will probably work with the FX312 model, else with the SP12X model. I would appreciate returns on what works and what doesn't (postmaster@scannav.com).
Valsat MLR uses NMEA mode for transfers, so there is no need to change the serial settings. Just check that the "Transfer Speed" is set to the same value than "NMEA Speed", that should be 4800.
But you have to tell the GPS to send or wait for routes and waypoints. This is done directly on the GPS.
To send routes and waypoints from ScanNav to the GPS, the GPS must be set to mode ENTREE NUMERIQUE = WAYPOINT (or WPTS + RTES depending on the model)
To receive routes and waypoints from the GPS to ScanNav, the GPS must be set to mode SORTIE NUMERIQUE = WAYPOINT, (or WPTS + RTES depending on the model)
Tracks are somewhat restricted on MLR GPS. In fact MLR Gps doesn’t keep date information. But certain models like the FX312 or SP24XC have the possibility to store some shorelines. ScanNav uses this possibility thru the Send or Receive Tracks buttons. So for MLR GPS we also let the user choose some routes when sending tracks. This lets you draw a shoreline using the “routes” tool, and send it after to the GPS.
To send or receive tracks or shorelines to the MLR GPS that support this feature, you have to set the interface « ENTREE » or « SORTIE » numérique to 'TRACE' or 'PROFIL DE CARTE'
Text Files:
Please also refer to the Release notesA special model named "Text File" enables you to export and import waypoints and routes to/from a text file that can be easily interpreted by applications such as Excel. This is a temporary solution, and it shall be moved to a more general import/export module in next releases. I hesitated letting the functionality in the released version, and finally, I left it "as is" the purpose being to have a quick implementation of an easily understandable exchange format. This format is a Comma separated fields format. There are 3 types of records:
1.
WPT: Waypoints.
WPT,latitude,longitude,name,symbol number,description
latitude is formatted as follows: ddmm.xxx N/S, with dd=degre,
mm=minutes, xxx=1/000 of minutes
and longitude: dddmm.xxx E/W with ddd=degre , mm=minutes,
xxx==1/000 of minutes.
Example: WPT,4435.216 N,00113.847 W,Banc d'Argin,0,commentaire sur
le banc
=> 44°35'216 N / 1°13'847 W
2.
RTE: Route.
RTE,route number ,number of waypoints included,route name,description
Example: RTE,0,9,argin,Du port d'arcachon au banc d'argin
3.
RPT: Route points.
RPT, latitude,longitude,name,symbol number,description
This record has the exactly the same format as the WPT record, except
for the "RPT" prefix. For a route containing 9 points, you should
have one RTE record followed immediately by 9 RPT records. Example:
RTE,0,9,argin,Du port d'arcachon au banc d'argin
RPT,4439.812 N,00109.097 W,W1,0,Le port
RPT,4440.247 N,00109.984 W,W2,0,
RPT,4439.889 N,00112.181 W,W3,0,
RPT,4438.176 N,00114.201 W,W4,0,
RPT,4437.358 N,00114.272 W,W5,0,
RPT,4436.769 N,00113.625 W,W6,0,
RPT,4435.552 N,00113.484 W,W7,0,
RPT,4435.191 N,00113.692 W,W8,0,
RPT,4435.216 N,00113.847 W,W9,0,Le banc
Clock synchronization:
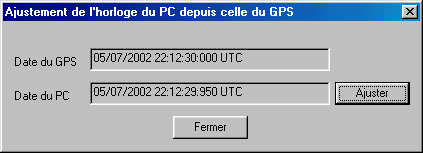
GPS gives you a very precise clock. This option lets you set your PC from the GPS clock, which is very precise. Just click on the « Adjust » button, and that’s it.
Interactive tools:
![]()
The currently selected tool in this list determines what
action is performed when interacting in the chart area with the mouse.
You can activate them directly with the appropriate icons, or through
the « Function » menu. These tools are grayed out if one of
the ![]() ,
, ![]() or
or ![]() are activated (see ScanNav.htm - select tool
for their description). To reactivate them, just unselect the last
mentioned tools.
are activated (see ScanNav.htm - select tool
for their description). To reactivate them, just unselect the last
mentioned tools.
Distances
and Bearing Tool: 
When this tool is selected, you permanently have in the Status bar at the bottom of the screen:
· The boat’s position
· The Cursor’s position
· The Bearing and distance from the boat to the cursor
If you click on a point of the map, that point replaces information concerning the boat until next click. This enables you to calculate distances and bearings between two points very easily.
Information shown can be configured, and you can also have them displayed in a separate window in a more visible way (see Displays )
If you double-click on the map, the boat moves to that point (useful while using the simulator).
If you click on the Tool while it is already selected, the screen centers on the boat’s last known position, and necessary maps are loaded.
Waypoints definition: 
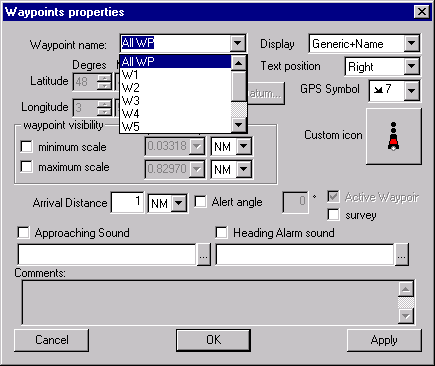
When this tool is selected clicking on the chart with the mouse’s left button creates a waypoint, and the following dialog box appears to confirm position and other parameters:
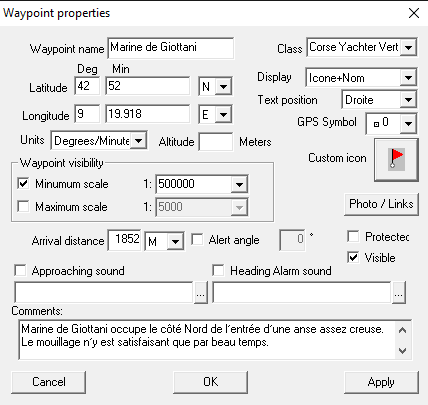
This dialog box also shows up when you click with the mouse’s right button on an existing waypoint in the chart area, or in the waypoints list of the objects window, and that you select the properties entry of the popup menu. Fields to fill are the following:
· Name: Waypoint’s name.· Class: Lets you group objects in « classes » so as to apply common action on them in an easy manner by sorting them by class in the object window (for example save/show/hide all objects pertaining to a specific class (see “objects management”)
· Comments: Enter any comment you wish. This can be for example a light’s characteristics, etc… It will show up in a popup window when you move the cursor on the waypoint if the popup-info option is active
· Position: It is expressed in latitude/longitude, you can choose the unit (degrees, degrees/minutes, or degrees/minutes/seconds), and enter decimal fractions.
· Waypoint visibility: Lets you define a scale interval out of which the waypoint won't be visible. This acts like in vector charts to avoid overloading a chart with unreadable topics, especially when you zoom out, and when waypoints defined at a detailed level end up by overlapping each other. Values given in standard scale units
- If a minimum scale is given (box checked) this means that from a certain level of zoom out (that is, when the chart gets less detailed), the waypoint will not show on the screen.
- If a maximum scale is given, this means that from a certain level of zoom in (that is when the chart reaches a certain level of details), the waypoint will not show up. This condition might seem strange, but you may want to show certain different waypoints at different scales.
When creating the waypoints the check boxes are off by default. (So waypoints are always visible), and scale limits are "prepared" so as to represent 5 times more detailed and 5 times less detailed if you check the corresponding box.
· Arrival distance: the distance from which the approaching alarm condition rises.
· Alert Angle: defines the angle between your heading and the waypoint’s bearing, from which the Bearing alarm condition raises. This value is only taken in account if the corresponding box is checked.
·
Approaching and Heading Alarm
sounds: you can define some alarm sound to be played when entering one
of the alarm conditions (waypoint must be active). To define a sound
you have to check the appropriate check box, and enter a “.wav” sound
filename in the corresponding input field. You can search for sound
files on disk, using the ![]() button adjacent to the input
field. A list of standard sound files are available in the
« Media » directory of Windows, that should be in
« C:\Windows\Media » or « C:\Winnt\Media »
depending on windows systems.
button adjacent to the input
field. A list of standard sound files are available in the
« Media » directory of Windows, that should be in
« C:\Windows\Media » or « C:\Winnt\Media »
depending on windows systems.
· Display: Lets you define the waypoint's appearance on the screen. You can choose:
1.
The type of symbol to display. This
can be:
-a generic symbol,
-the same symbol as the one displayed on your GPS, corresponding to the
GPS symbol number: Today, only the basic Garmin symbols (corresponding
to the Garmin 12) are present
-A customizable icon
-No symbol at all
2. If you want to display the waypoint's name or not.
· Text position: If you choose to display the waypoint's name, you can define it's position from the symbol (top, right, bottom or left)
· GPS symbol: corresponds to the symbol assigned to the waypoint when transferring from/to GPS supporting this functionality. Today, only symbols corresponding to the Garmin 12 are present (from 0 to 15). An additional choice "Other" is present at the end of the list. If you select this, the choice list transforms into a text-input field where you can input any number out of the range 0 to 15. If you desire, you can also create the symbol icon list corresponding to your GPS by following the instructions given a bit further down in this document.
· Custom Icon: Lets you choose a custom icon associated to the waypoint. By clicking on the associated button, you open an icon selector letting you choose among a list of symbol names, with an area to preview the symbol.
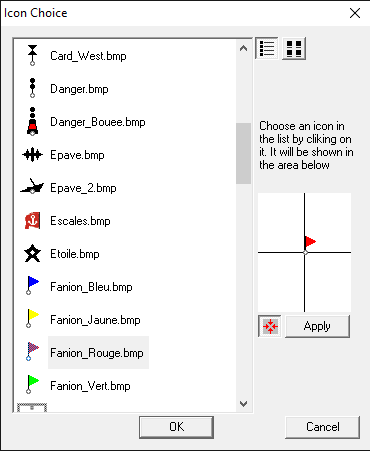
By clicking on one of these names, the symbol is displayed in the preview area. This area has a cross in its center. The "Hot Spot" of the symbol (the point of the image that will be on the requested geographic position) is drawn on the center of this cross. The list of available icons is not exhaustive, but you can very easily create your own custom icons by following the instructions given a bit further down in this document.
If the ![]() button is down, the preview
area gets active, and by clicking on it you can change the "hot spot"
of the symbol. It then re-centers on the new hot spot, and the "Apply"
button appears. The modification will only be effective if you click on
this "Apply" button. If meanwhile you select another item in the list,
the modification will be lost.
button is down, the preview
area gets active, and by clicking on it you can change the "hot spot"
of the symbol. It then re-centers on the new hot spot, and the "Apply"
button appears. The modification will only be effective if you click on
this "Apply" button. If meanwhile you select another item in the list,
the modification will be lost.
WARNING: If you modify an icon's hot spot, this will concern all waypoints using this same icon.
Creating your own GPS symbols list:
Only the basic Garmin GPS symbols (0 to 15) are available today. You can nevertheless create your own list by following these instructions: A symbol list is stored in a unique BMP format file, and a file named "gpsicons.lst" describes the contents of this file. For example you will find for the garmin12:
"0 15 16 garm12icon.bml"
This means that the file garm12icon.bml contains symbols from 0 to 15 included, and that each symbol is 16 pixels wide.
Actually, garm12icon.bml is in BMP format. Its extension is .bml just so that you don't select it as a custom icon. But you can view it with any graphic tool like paint (or ScanNav!) by copying it to another file with the .bmp extension. Here it is:
garm12icon.bml: ![]()
You can also have a file with the extension ".msk" appended at the end of the complete file name (extension included) of the symbol file. In our case, this is "garm12icon.bml.msk". This file is a monochrome (1bit) bmp file that must have the same dimensions as the symbol file. It contains the image's mask: only the pixels of the symbol that have the corresponding pixel of the mask file turned to black will be drawn. Other pixels will be transparent. If the mask file is not present the symbols will be drawn entirely opaque. Here is the mask for the Garmin 12 symbols:
garm12icon.bml.msk: ![]()
Creating your own custom icons:
Custom icons are simply BMP format files. 16 colors (4 bits) and monochrome (1 bit) bmp files let you define a transparent color (you can see the map through), and other bmp files are opaque:
· For monochrome bitmaps, only black pixels will be shown. White pixels are transparent.
· For 16 color bitmaps, one color is reserved for the transparent color. It is defined by the color of the pixel on the top-left of the bitmap (which is always transparent).
All symbol files must be in the "Icons" subdirectory of ScanNav. All you have to do to install your own custom icons is to copy them to this directory, and define its hot spot (centered by default). If you like, and if you send them to me, I can hold a database of user designed icons that I can put for free download on my web pages.
To define the "hot spot" of an icon, you can use
the ![]() tool
described above, or you can define it by changing the "iconalign.lst"
file present in the same directory. This file consists of one line per
icon, each line having two fields separated by a semi-column (;). The
second field is the icon's file name, and the first field is a keyword
(or decimal coordinates) defining the "Hot Spot" location. This keyword
can be one of:
tool
described above, or you can define it by changing the "iconalign.lst"
file present in the same directory. This file consists of one line per
icon, each line having two fields separated by a semi-column (;). The
second field is the icon's file name, and the first field is a keyword
(or decimal coordinates) defining the "Hot Spot" location. This keyword
can be one of:
CC: the hot spot is in the Center of the image.
CL: the hot spot is on the Left of the image and Centered vertically.
CR: Centered vertically, on the Right of the image
TL: Top Left of the image
TC: Top Center of the image
TR: Top Right of the image
BR: Bottom Right of the image
BC: Bottom Center of the image
BL: Bottom Left of the image
Instead of having a keyword, you can also give the hot spot's coordinates in the icon. These are from the left to the right, and the top to the bottom.
Example of "iconalign.lst" lines:
BC;Danger_Bouée.bmp
CC;Harbor.bmp
10 20;test.bmp
Common properties to several waypoints:
When you view properties common to several waypoints at a same time (for example all waypoints of a route, or several waypoints selected in the "objects" window), the name's input field changes to a combo-box list. This list contains one entry per waypoint, plus a special item "All waypoints" in the first entry. If this first entry is selected, only fields that can be common to several waypoints may be modified, and the modification will be applied to all the waypoints in the list. To change only one waypoint of the list, you have to select it in the list before.
Routes definition: 
When this tool is selected, you can define routes:
- Either directly on the map: By clicking on the map with the mouse’s left button, you start the definition of a new route, after which each following click defines a new segment. If you click on an existing waypoint, this waypoint will be added to the route; otherwise a new waypoint will be created. To finish the route definition, you can either double-click on the last point, or press the keyboard “Entry” key. When clicking with the mouse’s right button you suppress last defined point, and on pressing the keyboard “Esc” key, you abort the route definition. If you double-click on the chart before having started a route, you create a simple waypoint just as defined in previous chapter.
- You can also choose waypoints in an existing
list. To do that, just click a second time on the tool.
In both cases, the following dialog box appears:
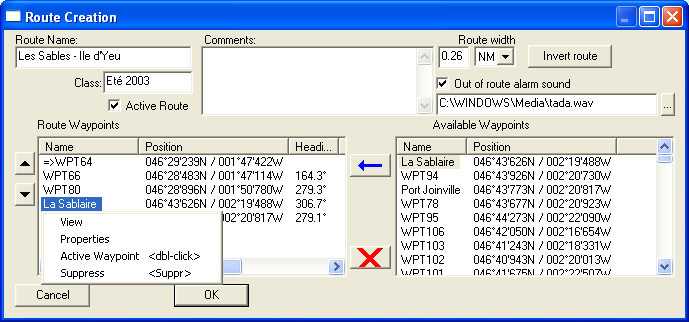
This dialog box also shows up when you click with the mouse’s right button on an existing route in the chart area, or in the routes list of the objects window, and that you select the properties entry of the popup menu. Fields to fill are the following:
- Just like the waypoints definition, enter a name and eventually a class and comment
- Route width: it is the width of the route’s corridor. If you get out this corridor, an alarm will be raised. A hatched area visualizes this corridor. The value you enter is HALF the width of the corridor. For example, if you enter 1 mile, the alarm will rise if you are more than 1 mile away from the route on either side, which means your corridor is 2 miles wide… This value can be entered in Nautical Miles (NM), Kilometers (KM) or Meters (M).
- If “Active Route” is checked, this is the route actually surveyed by the GPS interface. You can only have one active route at a time. (See chapter “Navigation control”)
- You can define an alarm sound that will ring if you get out of the active route corridor.
- You add waypoints to the route displayed in the left hand side list by choosing them in the right hand side list, and clicking on the blue arrow, or on double clicking on an element. Waypoints are added at the end of the route.
- You can change one or several waypoints position in the route by selecting them and moving them up or down in the list using the up and down arrow on the left.
- By clicking in the left hand side list with the mouse’s right button, you raise a popup menu letting you perform different actions on the selected waypoints.
- You can suppress waypoints from a route by selecting them in the left list and clicking on the red cross, or by pressing the “Del” key on the keyboard, or by using the contextual menu.
- You can define the “Active” waypoint of the route by double clicking on it, or using the contextual menu (right click). It is then represented preceded with an arrow. (See chapter “Navigation control”)
- You can sort the waypoints in the right list:
- By name: just click on the “name” header
- By position: select a waypoint in either lists, and click on the “position” header of the right list. Waypoints will be sorted according to their distance from the previously selected waypoint.
- “Heading” and “Step distance” in the right hand side list represent the heading and distance relative to the preceding waypoint, and “Accumulated distance” the total distance starting from the first waypoint of the route.
- This window can be reshaped like any other Windows window supporting this functionality: Either by clicking and dragging on it’s edges, either by clicking on the top–right square to make it full screen. This will let you handle more visible waypoints.
- You can change the visible ratio of the left hand side and right hand side lists by clicking anywhere in the window’s background gray array, and by dragging the mouse to the right or left.
It is possible further on to extract information from the route legs to create annotations on the chart (see further « creation of annotations » - « specific racing usage »)
Danger Areas definition: 
When this tool is selected, you can define danger areas by clicking on the map with the mouse’s left button on different spots to surround the area. Each click creates a new segment. To finish the area definition, you can either double-click on the last point, or press the keyboard “Entry” key. When clicking with the mouse’s right button you suppress last defined point, and by pressing the keyboard “Esc” key, you abort the area definition.
Once you finish the area definition, the following dialog box appears:
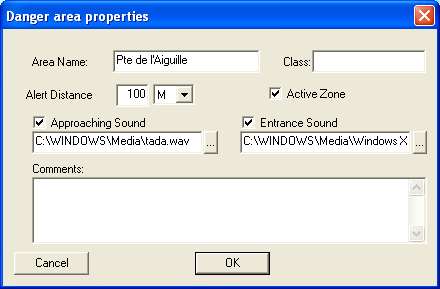
This dialog box also shows up when you click with the mouse’s right button on an existing danger area in the chart area, or in the areas list of the objects window, and that you select the “properties” entry of the popup menu. Fields to fill are the following:
· Just like the waypoints and routes definition, enter a name and eventually a class and comment
· If “Active Zone” is checked, the GPS watches for this area. You can have several Danger areas active at a same time.
· Alert Distance: This is the distance from the boat to the nearest point of the area from which the proximity alarm will ring. This value can be entered in Nautical Miles (NM), Kilometers (KM) or Meters (M).
· The approaching sound will be played if you get nearer than the above-defined distance, and the Entrance sound will be played if you enter inside the area.
·
Creation of Annotations: 
This tool lets you add text annotations to the chart, in a very similar way to waypoints
Select tool ![]() , and click
on the location of the chart where you want the new annotation to be
added. The following dialog opens:
, and click
on the location of the chart where you want the new annotation to be
added. The following dialog opens:
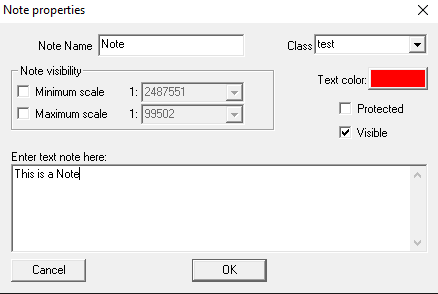
Just like the waypoints definition, enter a name and eventually a class.
Enter the text that will show at the given location. You can choose the color of the text and limit the visibility to a given scale just as for waypoints.
A Note is not assigned to a particular map, but to a geographic location. It will be displayed at this location whatever the chart underneath is.
This functionality will be extended to the workshop mode in future releases. In this perspective, the note will be only visible when the attached map is visible.
Specific implementation of notes related to routes (racing usage):
This usage consists in creating a note automatically pre-filled with information on a route leg.
To create the note click on the route leg with the mouse’s right button, and choose one of the two entries in the menu « WPT1->WPT2 », or « WPT2->WPT1 » according to the desired direction (replace WPT1 and WPT2 with the names of the waypoints delimiting the route leg). A new note will be created at the place you right-clicked. It is pre-filled with the following information that you may modify or complete manually before validating:
- Name of the route leg (from the name of the 2 delimiting waypoints)
- Heading to take
- Distance of route leg.
Tracks properties:
You can consult the tracks properties thru the popup menu displayed when clicking on a track with the mouse’s right button (in main window or in objects window). The following dialog box appears:
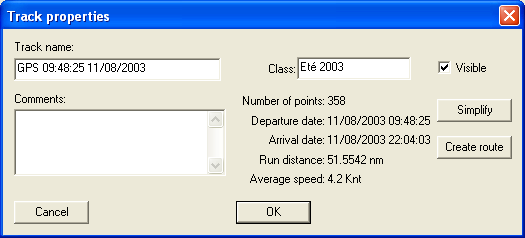
Apart from general track information you can simplify this track, or create a route out of it. These 2 operations are described later in this document.
Reshape of routes, danger area, waypoints and notes: 
This tool lets you modify routes or danger areas, or move individual waypoints.
· By clicking on the mouse's left button on a route point, a waypoint, or a definition point of a danger area, you can move it (push the button down on the point, drag it, and release the button on the new spot).
· You can also add a new route point or a new area definition point. For this, you have to press and maintain the <Ctrl> key on the keyboard while you click on a route segment or danger area.
· And to suppress a route point or an area definition point, click on it while maintaining the <Shift> key down.
Track Analysis: 
Please refer the the new separate document: DocAnalyse.pdf
Track Simplification:
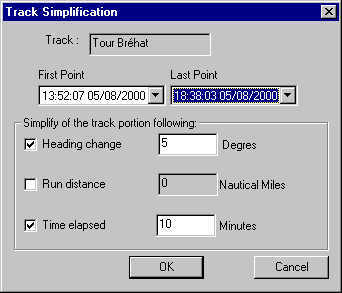
This functionality lets you eliminate superfluous points of a track or track portion. Indeed, by default, all GPS points are kept in the track, and it can become quite big.
It can be called:
· Either from the "Simplify" entry of the contextual menu appearing if you press the mouse right button on a track: In this case, the concerned portion is initialized with the entire track.
· Either from the "Simplify" button of the Analysis tool control box: In this case, the concerned portion is initialized at the analyzed portion (cf. preceding chapter).
The portion to simplify can be changed through the First Point and Last Point choice lists.
Simplification will be made according several criteria: heading change, run distance, or time elapsed. In the above example, points with a heading not varying more than 5° will be eliminated, keeping at least one point every 10 minutes.
List of Referenced objects: 
You can manipulate the lists of routes, waypoints and areas through the « Object » entry of the « View » menu. You get a new window resembling the Windows explorer. On the left-hand side, you get four « directories » that correspond to the Danger areas, Routes, Tracks and Waypoints. When clicking on one of these chapters, you get on the right hand side a list of the Objects of this type, with information specific to the type of object. If you open the Routes or Track chapter (by clicking the « + » symbol), you get the list of routes or tracks just under, and by clicking one of these routes or tracks, you get the details of the belonging waypoints or track points on the right hand side. This is useful for consulting information logged by the GPS interface (like dates, positions, speed, and bearings…)
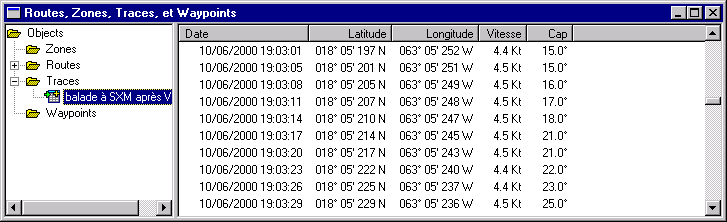
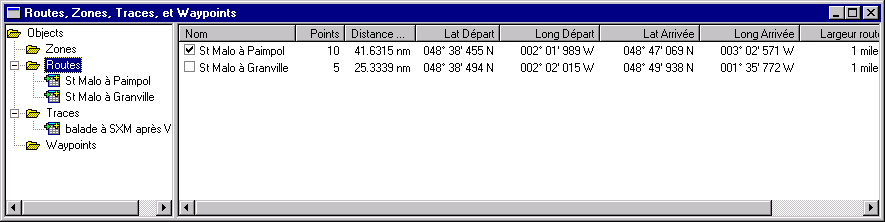
Lists of objects in the right hand side are composed of:
· A check Box: if checked, the object is « Active »
· Object’s name: if you click on it while selected, you can change it, like you rename a file in the Windows Explorer.
· List of properties dependant of the objects’ type.
If you double-click on an item with the Left button, you open the property box for this object.
If you click with the mouse’s Right button on an element of the list, a contextual menu appears
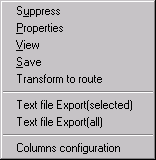
· Suppress: deletes the selected objects
· Properties: opens the property box for the selected object.
· View: centers the main screen on the object
· Transform to route: (only on tracks when "Tracks" is selected in the left-hand part). This lets you create a route from a track following several criteria's: Change of heading, distance between points, and elapsed time. These can be entered with the following dialog:
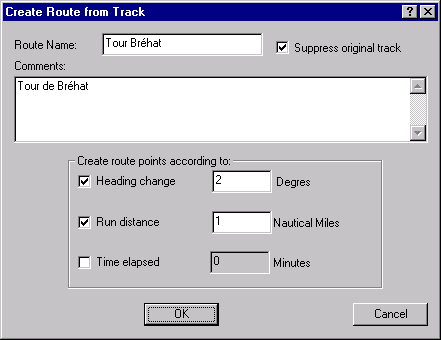
You can also choose to keep or discard the original track with the "Suppress original track" checkbox.
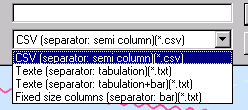
· Text File Export: lets you export the all list or just the selected items in a text formatted file that can be handled by other applications such as the windows Note Book or Excel. Several text output formats are proposed that only differ from the separator between fields: CSV is particularly adapted for exporting to Excel, "Fixed columns" is useful to make route sheets and print them out with the Windows Notepad. Other formats are just variants…
· Columns configuration: Opens a dialog box that lets you choose what type of information you want to display as well as the columns order. It is similar for the "Objects" window and the "Map Library" window:
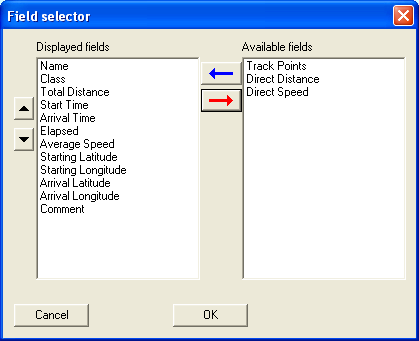
You add displayed columns by selecting them in the right-hand side and clicking on the blue arrow to move them to the left-hand side. Similarly, you retrieve columns from the display by selecting them on the left-hand side and clicking on the red arrow to move them to the right. You can also change the order of the columns (left to right) by selecting items on the left-hand side and moving them up or down using the left-hand side arrows.
· Save: saves the Selected objects in a file,
The objects (Routes, Danger Areas, and Waypoints) can also be Saved on, or Read from disk through the main window’s « File » Menu with « Save Objects », or « Insert Objects ». There are 4 types of « Objects » files:
· .rte: meant to contain routes (or tracks)
· .zne: meant to contain Danger Areas
· .wpt: meant to contain Waypoints
· .zrw: can contain a mix of different object types