


The Performance module includes Routing, Laylines, and Polar management functionalities
Routing:
Routing takes into account the following points:
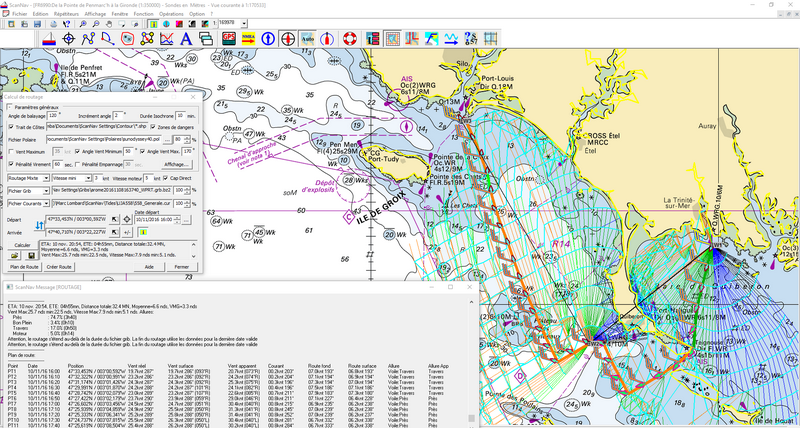
- Choice of the GRIB file and the boat Polar file
- Consideration of tidal currents. The information is based on the SHOM data or currents in GRIB form
- Possibility to apply a percentage ratio to polar, weather or current information
- Possibility to take the engine into account (sail only, mixed sail and engine, or engine only).
- Takes in account Shorelines, and/or user defined danger areas
- Possibility to apply Tack and/or Jibe penalties
- Possibility to avoid areas above a user defined Wind strength
- Possibility to define upwind and downwind limit angles, to avoid uncomfortable points of sail
- Multi-point routing
- Best Start calculation added in version 17.1
- Route Plan and Best Start Tables
- Ability to interact with the routing graph to find alternatives
- Export of the final route, and route plan
Laylines:
Starting with version 26.0, ScanNav integrates Layline management into the Performance module.
Two types of laylines are available:
- "Current" Layline: takes into account the current course from real-time instruments: The layline represents the ground course on the opposite tack, with the same apparent wind angle, the current tack being represented by the vessel's ground heading line.
- "Polar" Layline takes into account the best course from the polar diagram: Two lines represent the best ground courses on the current and opposite tacks.
For each type of layline, there are 2 Levels:
- Layline without a destination point: a simple line allowing you to visually determine if you are rounding a heading.
- Layline at waypoint (if a destination waypoint is active): represents the complete layline to the waypoint, highlighting the optimal turning points.
Polars:
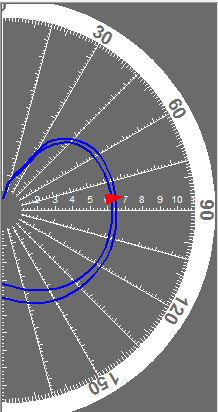
The Performance module also includes a Polars module which, in addition to managing the polars used for routing and laylines, allows visualization, via a dedicated repeater, of real-time performance compared to theoretical selected polar.
The Display shows where the real-time performance is.
- On the graph, the red triangle is the boat.
- Theoretical performances are the blue curves (the 2 curves being those defined in the polar file, with the wind immediately lower and higher than the actual instantaneous wind of the anemometer).